1.jpg
Indiranagar · traffic story
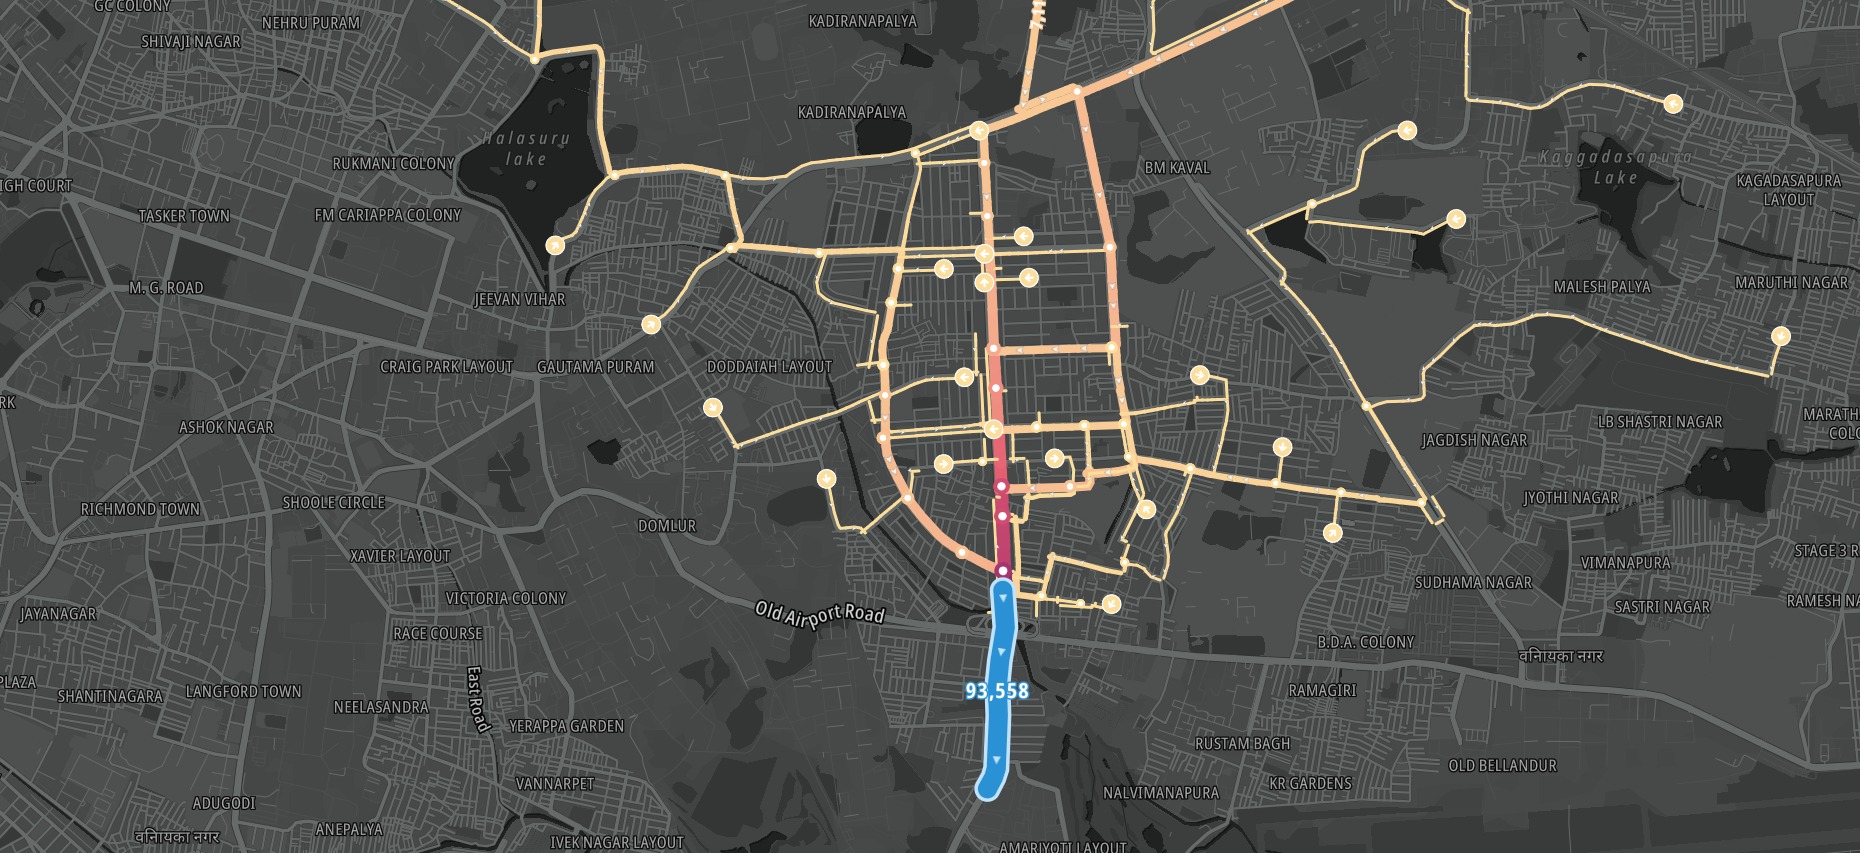
A traffic analysis of 100ft Road.
You can zoom into every map. Click or tap any image to open a zoomable view, then scroll, pinch, use the controls, and drag to inspect the route labels closely.
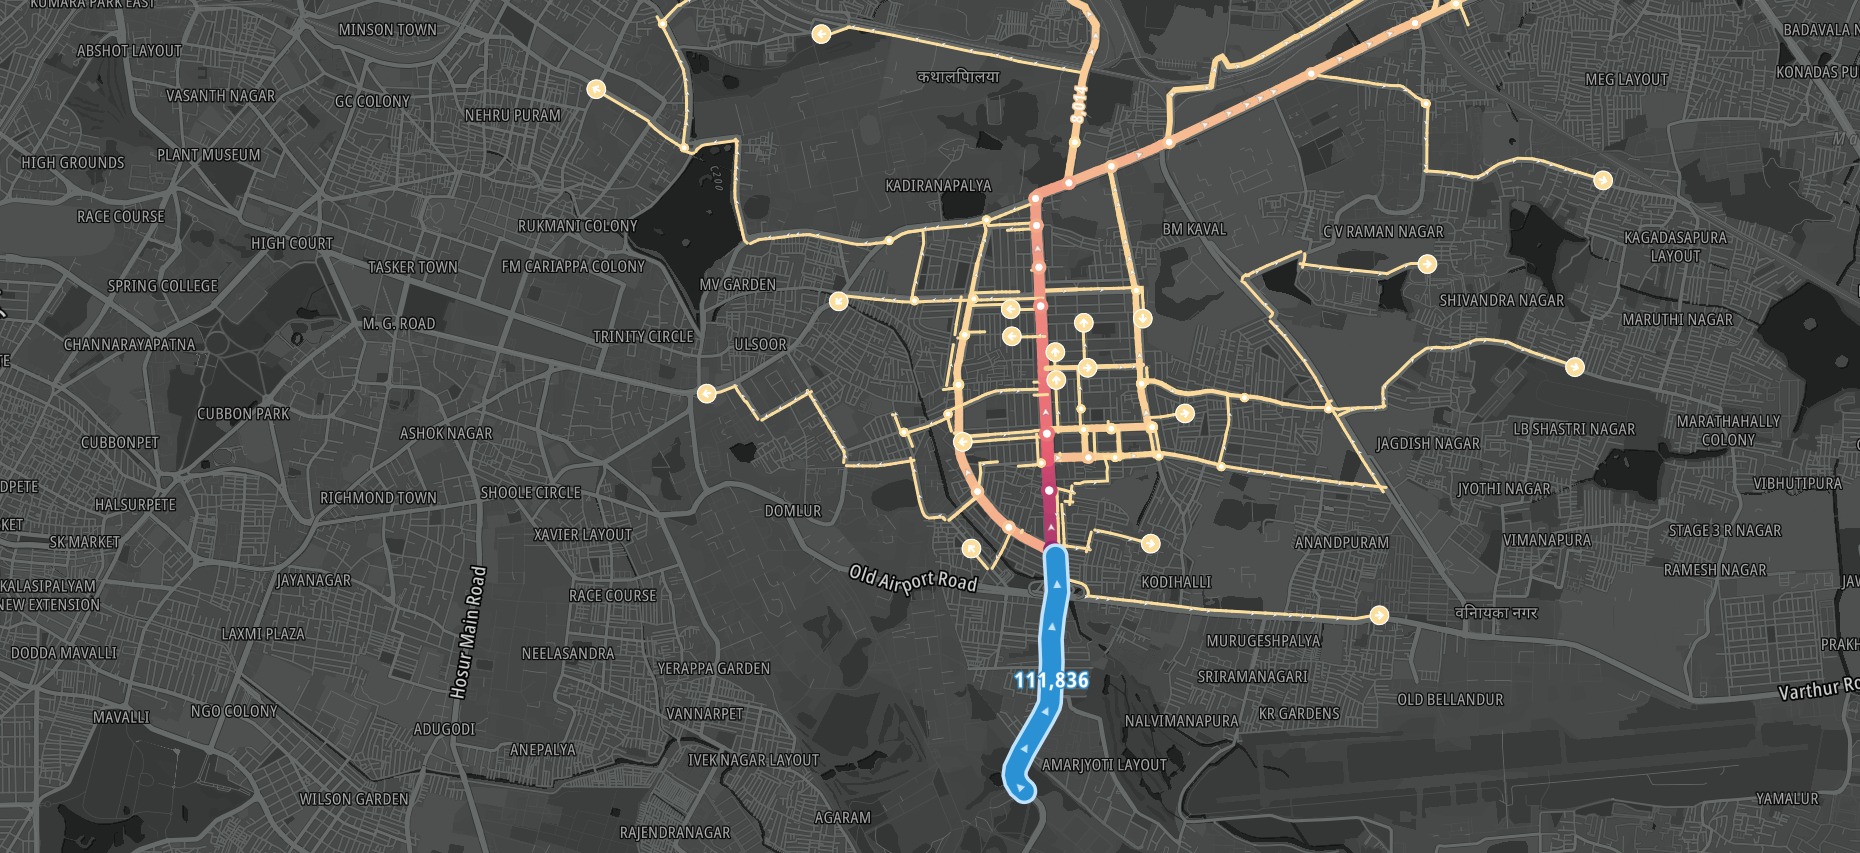
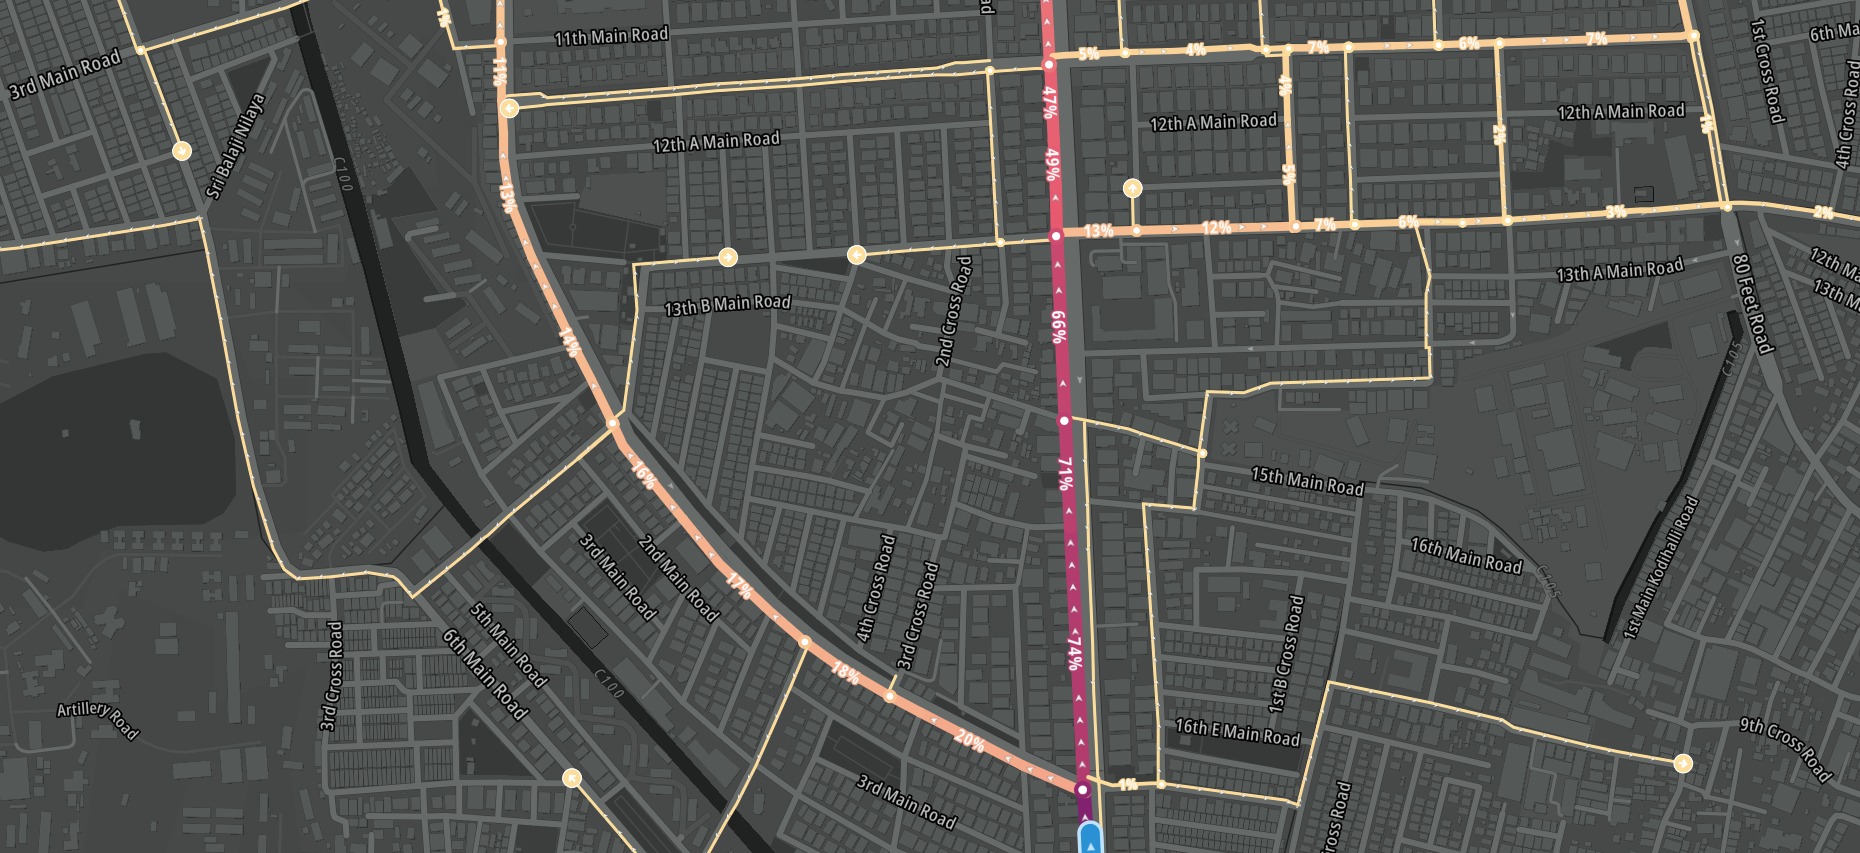
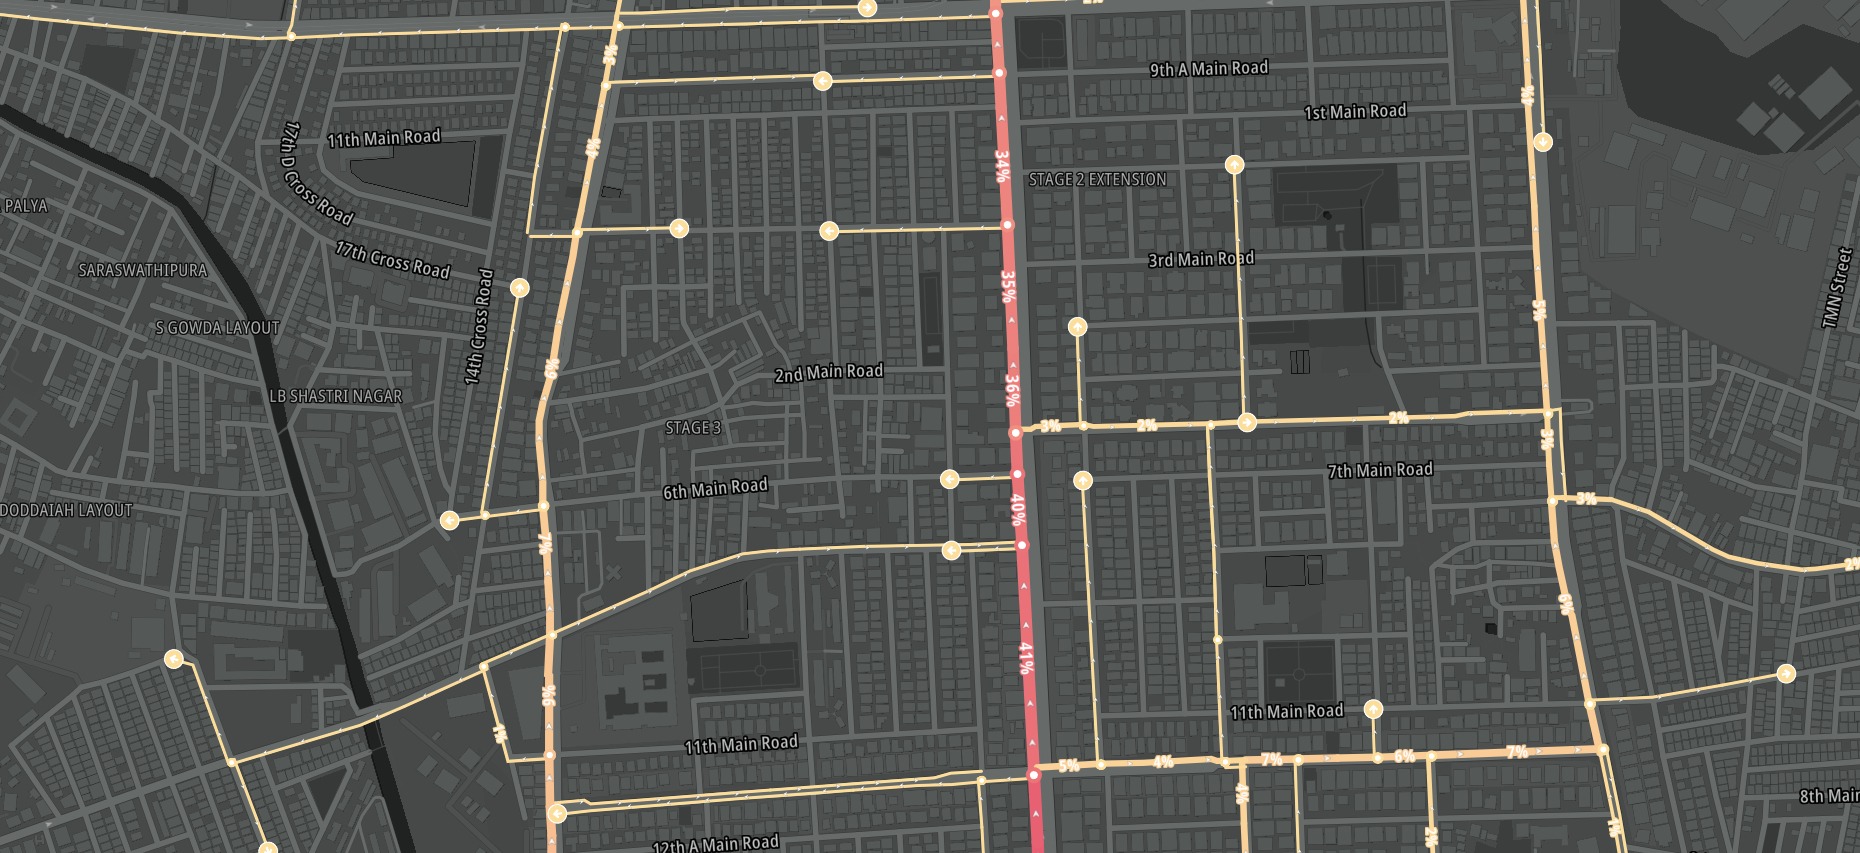
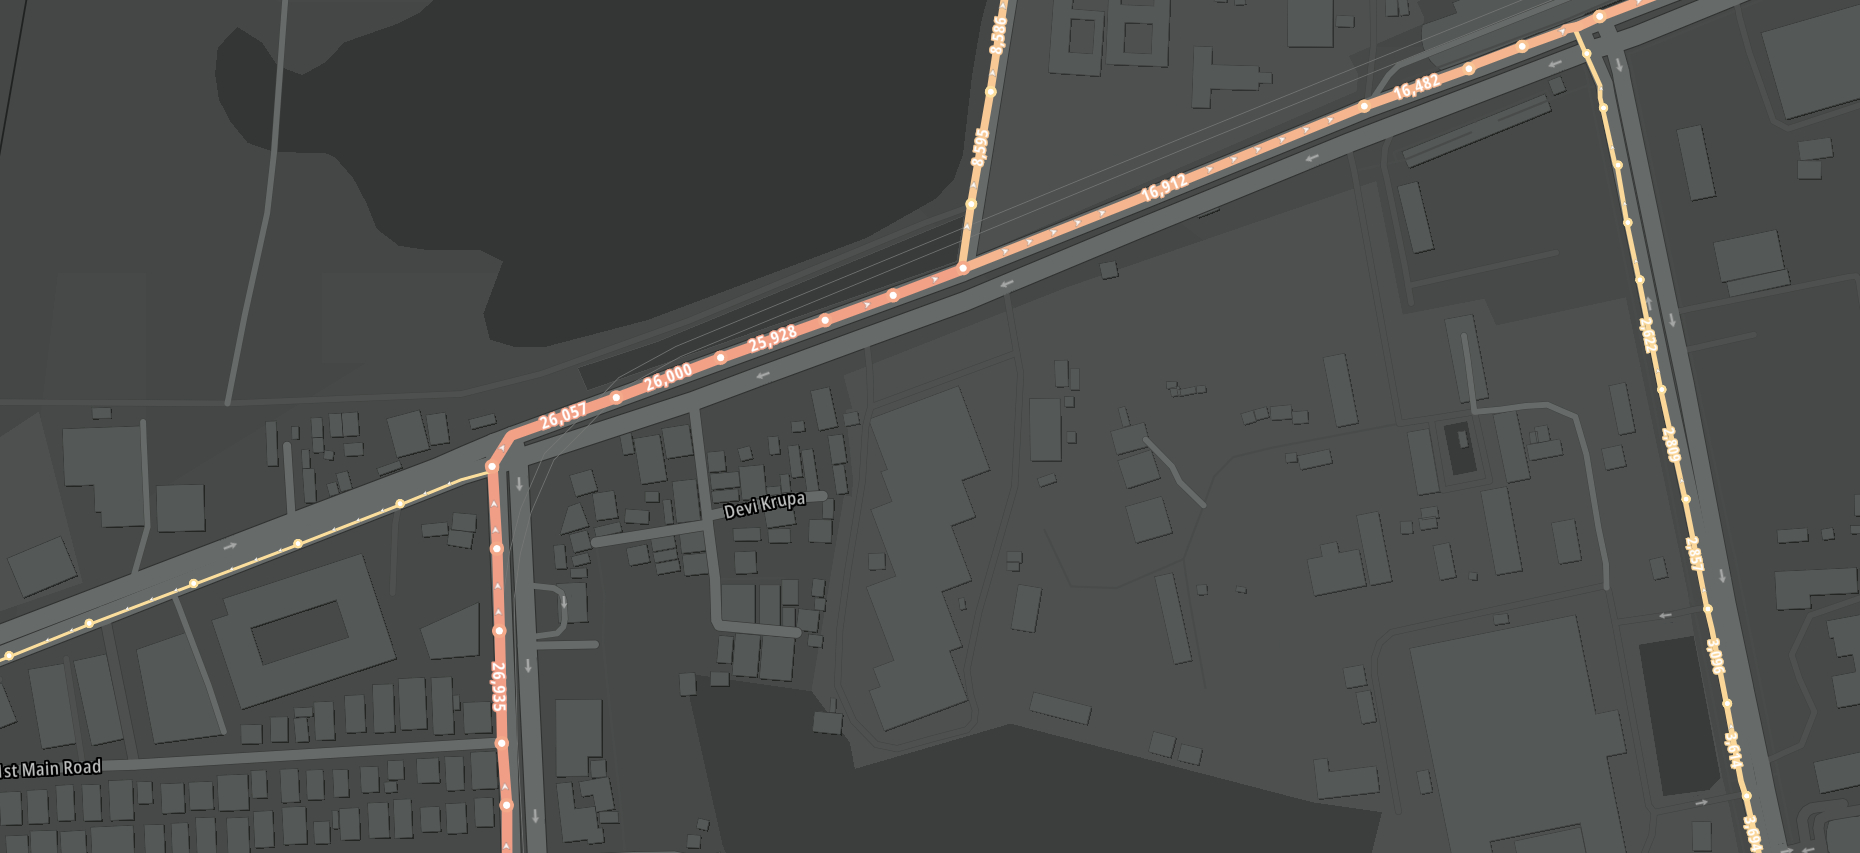
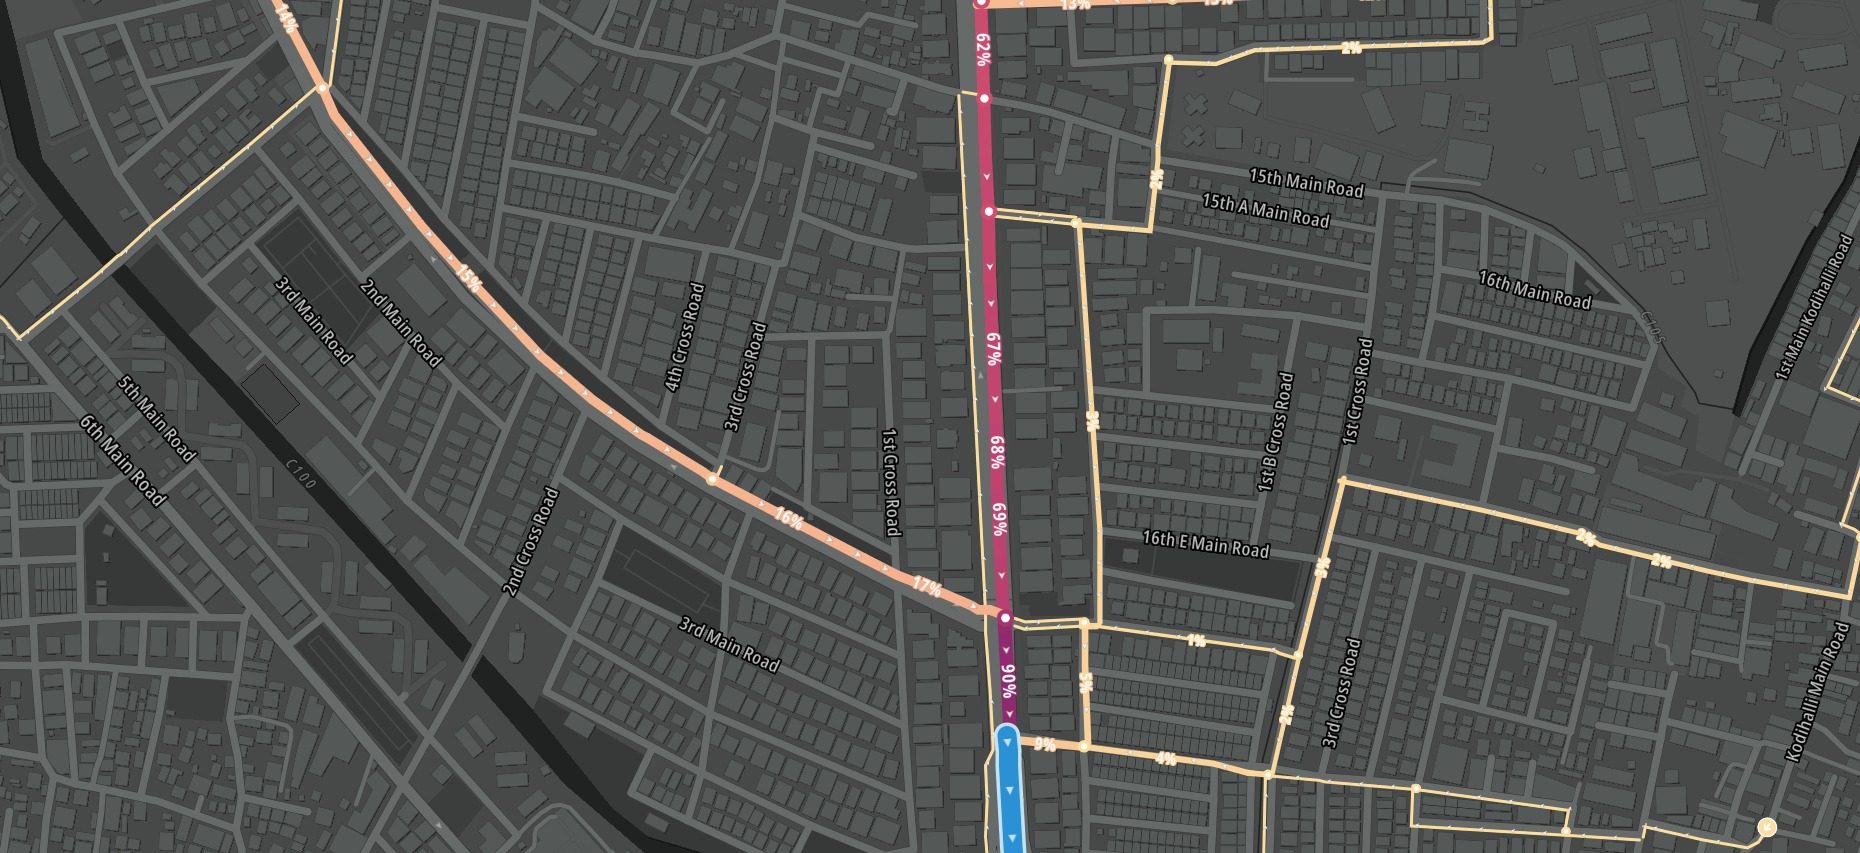
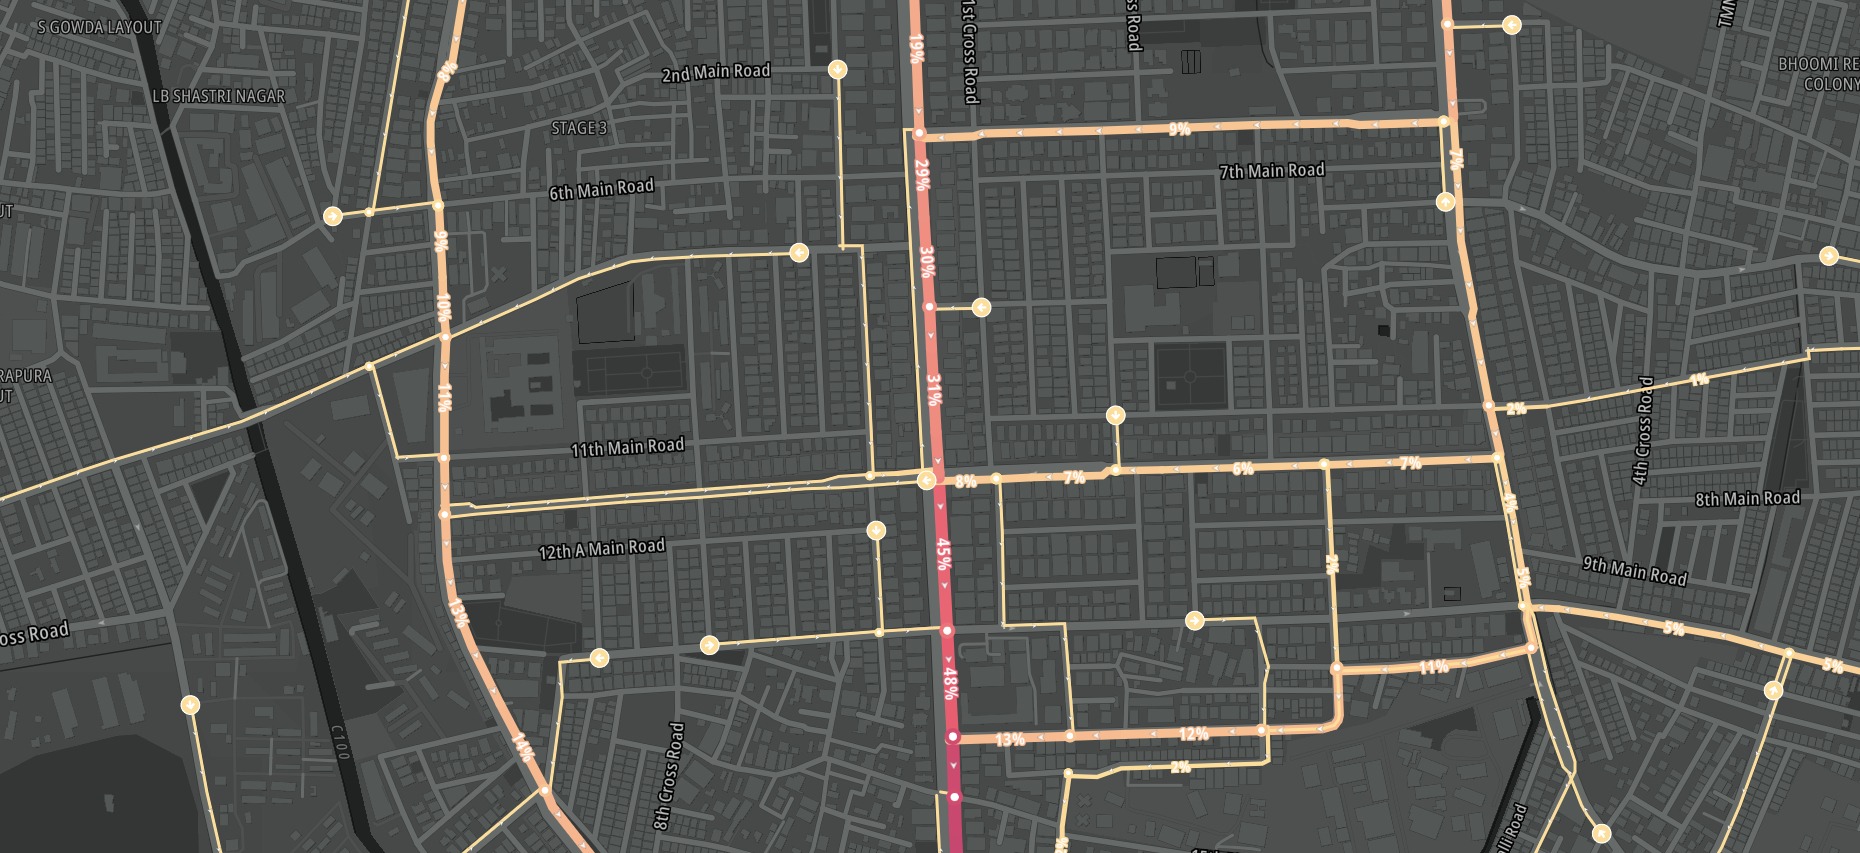
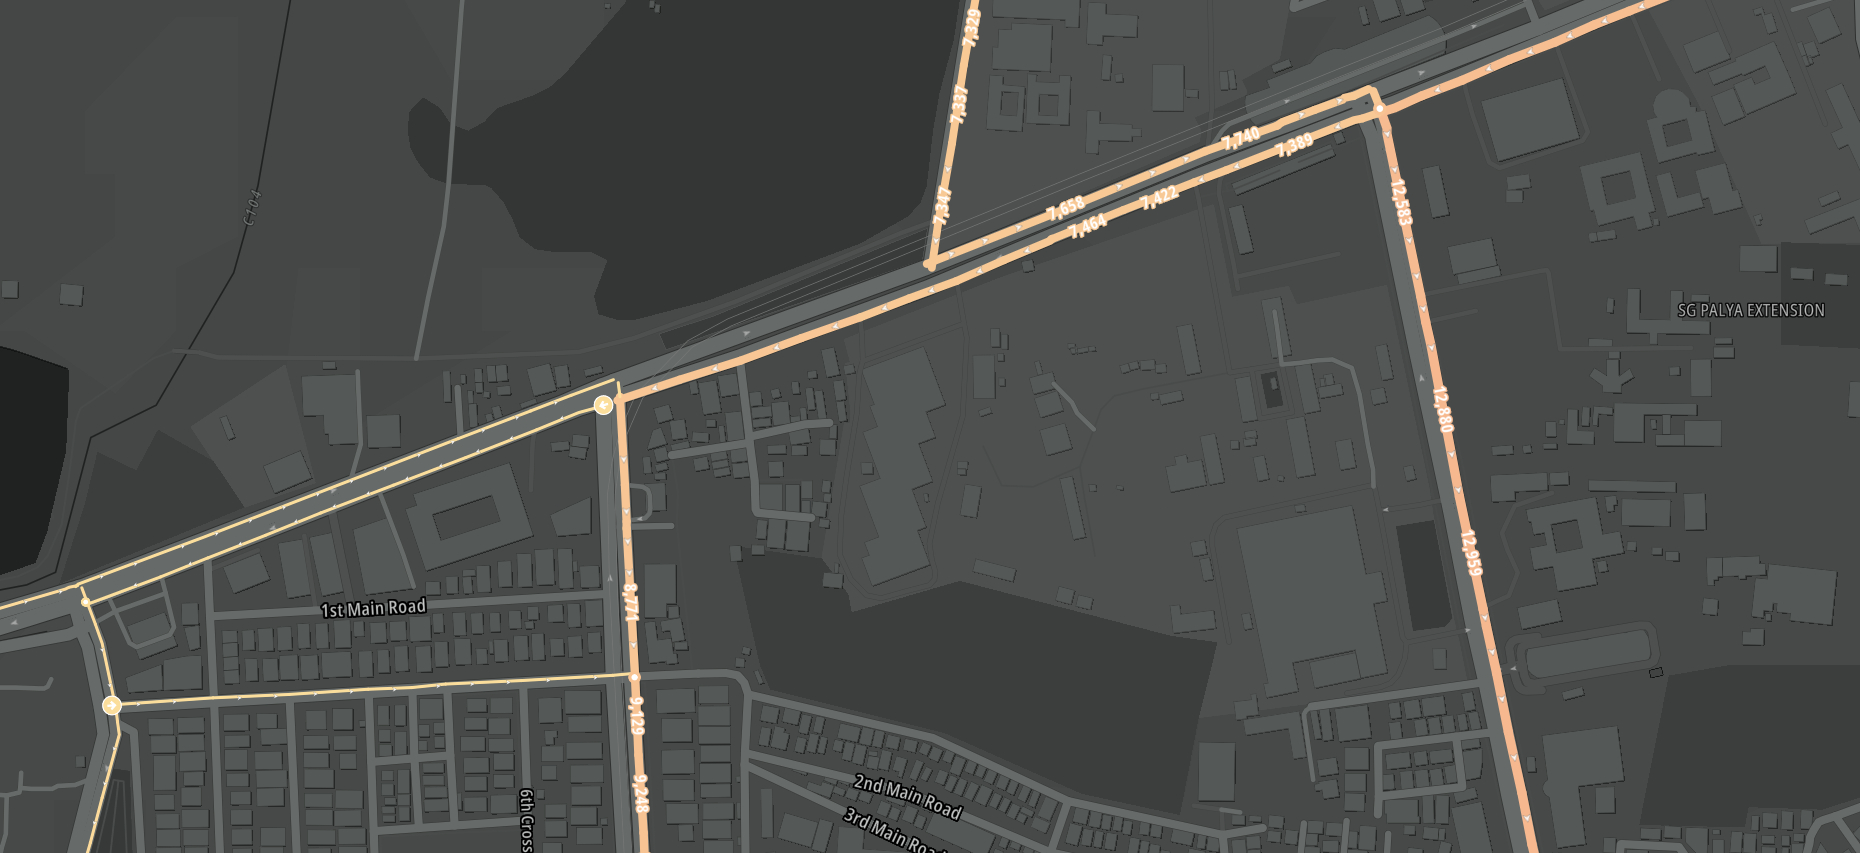
The key question is not just how much traffic is on the road, but how much of it is actually making the full movement the elevated corridor claims to serve.
The reverse movement shows the same pattern: much of the traffic disperses into or out of the neighbourhood network.
Bottom line
The DPR puts the number at about 30,000 vehicles per day. As seen in the analysis, a majority of those vehicles may not be the ones this elevated corridor seems to target.
Analysis done using TomTom’s O/D Traffic Analysis Platform.